Historical usage analysis
Explore your half-hourly consumption history with contextual insights that reveal where usage patterns are trending over time.
Octopus Usage Insights for Mac and iPad gives you rich historical trends, tariff-aware forecasts, and personalised tips so you can understand every kilowatt hour whether you're at your desk or on the go.
Clear insights, precise alerts, and flexible controls built for Octopus Energy users.
Explore your half-hourly consumption history with contextual insights that reveal where usage patterns are trending over time.
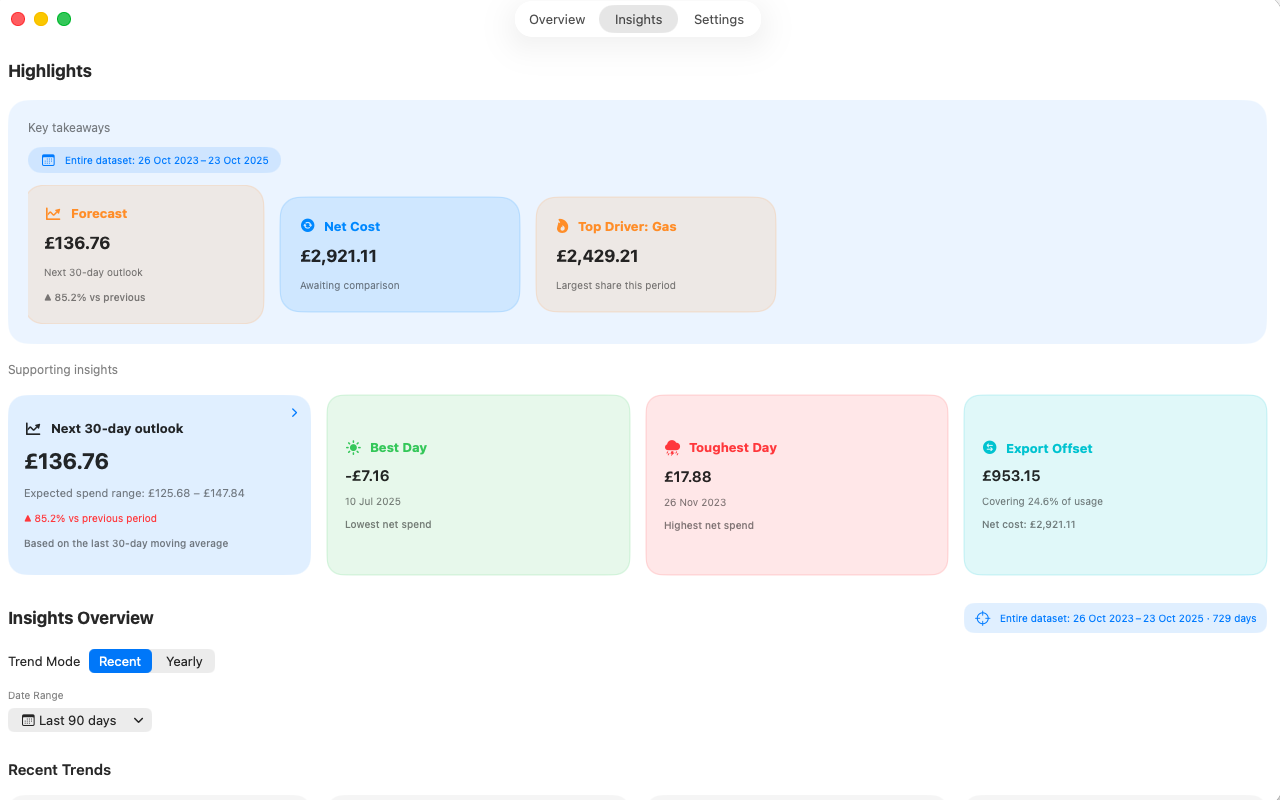
Get timely summaries that surface unusual spikes, best and toughest days, and export offsets so you can act before the next bill arrives.
Track every rate window for your Octopus smart tariff, compare peak versus off-peak costs, and pinpoint the best time to run energy-hungry appliances.
Line up this month against the same month last year—or this week versus last week—to see exactly how your usage is trending.
Compare today's spending with your baseline and track the monthly savings you unlock by shifting usage into cheaper windows.
Focused native views built for Mac and iPad so the insights you need are always close.
Join early adopters turning data into actionable savings across desktop and tablet with the same powerful experience.
Prefer email updates? Get in touch